Are you actually getting better at Amazon Creator Connections, or are your numbers quietly sliding the wrong way while you’re busy filming? For a long time I couldn’t answer that question honestly. I had earnings reports, sure, but a pile of CSVs isn’t insight — it’s homework. So we built a new Oink for Influencers update that turns your Creator Connections reports into clear product performance and trend data. You see which products are pulling their weight and whether you’re climbing or dropping over time. Let me show you how it works.
In This Article
- The Question Most Influencers Can’t Answer
- The New Product Performance Report
- Affiliate Plus and EPC, Explained
- Top Tracking ID for Pro Users
- How to Upload Your CC Earnings CSVs the Right Way
- How Oink Trends Compares Your Periods
- Daily Monitoring Spots Momentum Early
- Turn Your Data Into Your Next Content Plan
The Question Most Influencers Can’t Answer
Ask most Amazon influencers whether they’re improving at Creator Connections and you’ll get a shrug or a gut feeling. That’s not their fault. The raw reports tell you what happened, but they don’t tell you the story — which products are carrying you, which are fading, and whether this month is genuinely better than last or just feels that way. Without that, you’re promoting on instinct and hoping it works out.
This update is built for the creators and affiliates who are done guessing and want to make data-driven decisions about what to promote. Instead of staring at a CSV, you get a ranked, readable picture of your performance and the direction it’s heading.
The New Product Performance Report
The centerpiece here is the new Product Performance section. It takes your Creator Connections products and ranks them so you can immediately see which ones are pulling their weight and which are dead weight. No scrolling through hundreds of rows trying to eyeball patterns — Oink does the sorting and surfaces what matters.
This is the view I check first now. Before I plan any new content, I want to know which products are actually converting, because that’s where my next video should probably point. The report turns a months-long pile of earnings data into a single, scannable ranking.
Affiliate Plus and EPC, Explained
Two numbers in the report deserve your attention: Affiliate Plus and EPC. Affiliate Plus reflects the boosted commission side of Creator Connections — the extra earning power a product carries when it’s in an active campaign. EPC, earnings per click, tells you how efficiently a product converts the traffic you send it. A product with strong EPC is making the most of every click, which means your content for it is doing its job.
Read together, these two metrics tell you more than a raw earnings total ever could. A product might show modest total earnings but a high EPC, which tells you it converts beautifully and just needs more eyes on it. Another might show big totals but weak efficiency. Knowing the difference is how you decide where to spend your next batch of effort.
Top Tracking ID for Pro Users
If you’re on Oink Pro, there’s an extra layer: top tracking by ID. For each product, you can see which of your tracking IDs is driving the performance. That’s huge if you run multiple tracking IDs across different platforms or content types, because it tells you not just which product is working, but where the winning traffic is coming from. You can double down on the channel that’s actually delivering instead of spreading yourself thin across all of them.
How to Upload Your CC Earnings CSVs the Right Way
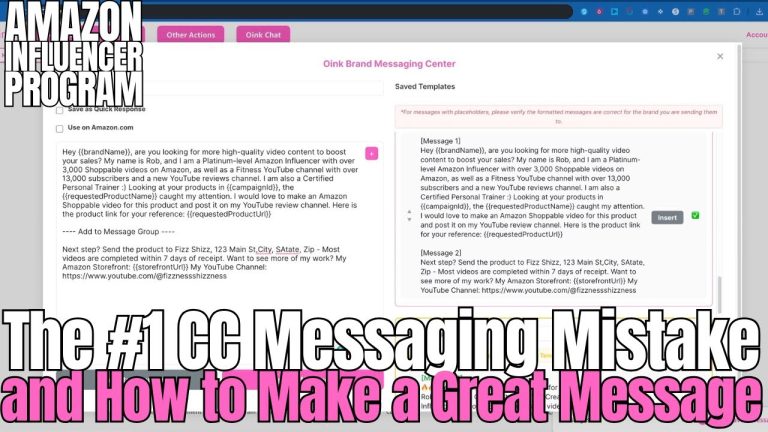
To power all of this, Oink needs your Creator Connections earnings data, and you feed it in by uploading your CC earnings CSVs. In the walkthrough I show you exactly where to find the Creator Connections earnings page on Amazon, how to export the right report, and how to upload it into Oink so it parses cleanly. Do it right and your Product Performance report and trends populate immediately.
One tip: upload consistently. The more of your history Oink has, the more meaningful the trend comparisons become. A single upload gives you a snapshot; regular uploads give you a trajectory.
How Oink Trends Compares Your Periods
This is the part I’m most excited about. Oink Trends takes your last 30 days and compares them against prior periods, so you can finally answer that opening question with data instead of a feeling. Are you up or down? Which products gained momentum and which lost it? You see the movement, not just the snapshot.
Trend data is what separates a creator who reacts from one who anticipates. When you can see a product climbing early, you can pour content into it while it’s heating up. When you see one cooling off, you can decide whether to refresh it or let it go before it drags on your numbers.
Daily Monitoring Spots Momentum Early
Oink doesn’t just compare periods when you happen to check — it monitors your trends daily. That means momentum gets caught early instead of weeks later when you finally sit down to review. Catching a rising product on day three instead of day thirty is the difference between riding a wave and missing it. The same goes for catching a slide before it becomes a slump.
Turn Your Data Into Your Next Content Plan
Here’s how I actually use all of this. I open the Product Performance report, find my strongest performers by EPC and Affiliate Plus, check the trends to see which are climbing, and that becomes my content shortlist. Pair it with your Comparison Video Schedule and Storefront Cross Check, and you’ve got a closed loop: data tells you what to film, you film it, the next upload tells you whether it worked. That’s how you stop guessing and start compounding.
If you’ve been flying blind on your Creator Connections performance, this update hands you the dashboard you’ve been missing — product rankings, EPC and Affiliate Plus breakdowns, and daily trend monitoring, all in one place and built for free and pro users alike. Upload your CSVs, watch your trends, and let the data tell you what to promote next. Get started at oinkforinfluencers.com and turn your reports into real decisions.